Support: Driver Safety Rating User Manual
Log In
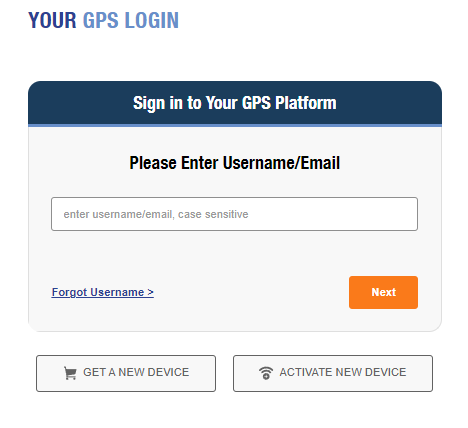
Please go to brickhousesecurity.com/login/gps.
Enter the username or email address from the login email you received, then click Next. Enter the password and click Log In. The characters used in these fields are case-sensitive. You will be asked to update the password when you first log in.
Eco Driving
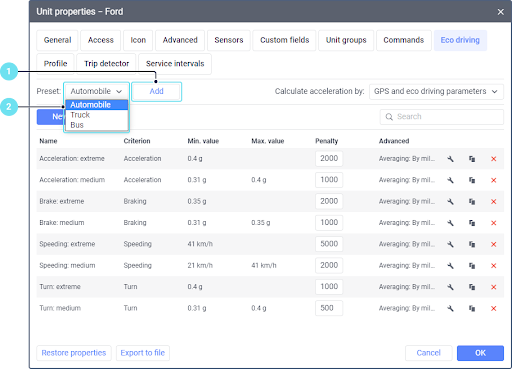
Once logged in, go to the Unit Properties by clicking on the wrench icon next to the unit you want to edit then click on the Eco Driving Tab. On this tab, you can select the vehicle type being tracked, Automobile, Truck, or Bus, in the Preset dropdown. The default values will appear when you click the “Add” button. This is the only field we recommend updating in the Eco driving tab.

After adding the criteria and specifying all the required parameters, you can view a report with detailed information about all the violations on the Eco Driving app.
Analyzing this data can help prolong fleet life, cut fuel expenses, ensure cargo safety, and offer insights into emergencies.
To get a driving quality assessment, adjust the settings on the Eco Driving tab in the unit properties of the monitoring system.
Calculating Acceleration
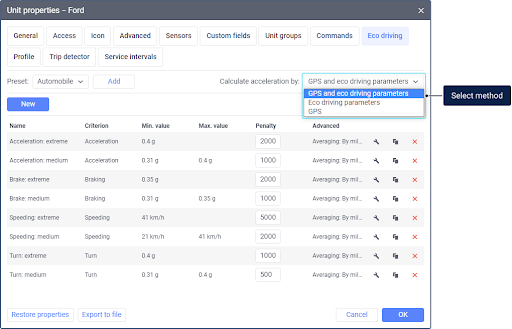
Acceleration is the difference in the unit speed divided by the difference in time. The movement direction of the unit allows for determining the acceleration type: speeding, turn, reckless driving, etc. When calculating acceleration, the following data is used: unit location, initial and final speed values, travel time between two points, unit movement direction, and values of special parameters sent by the device. By default, acceleration is calculated using the GPS and eco-driving parameters method. We strongly recommend that you do not change this.
Adding criteria
You can add eco driving criteria by applying a preset or creating them manually.
Adding criteria using a preset
Depending on the vehicle type, you can add a list of criteria with the already configured parameters. To do this, select the required preset from the three available options (Automobile, Truck, Bus) and click Add.
Driving Quality Assessment Parameters
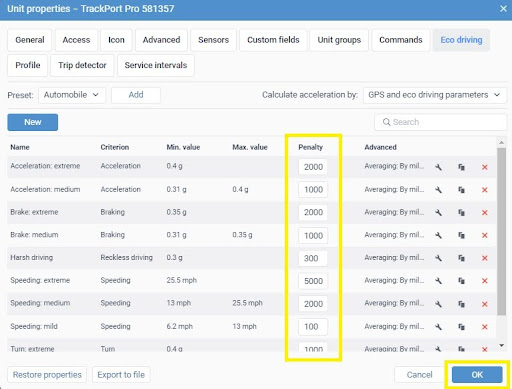
To penalize driving quality violations, you need to enter the number of penalty points for each parameter that is evaluated. This is done by specifying the penalty points in the Penalty field. Once you have set the penalty points for each violation based on the selected criterion, click OK to save them.
The penalty points are then converted into the 10-point assessment system using the following algorithm:
|
Penalty |
Rank |
|
0 |
10.0 |
|
0-17 |
9.0–10.0 |
|
17–38 |
8.0–9.0 |
|
38–67 |
7.0–8.0 |
|
67–107 |
6.0–7.0 |
|
107–167 |
5.0–6.0 |
|
167–267 |
4.0–5.0 |
|
267–467 |
3.0–4.0 |
|
467–1067 |
2.0–3.0 |
|
More than 1067 |
1.0–2.0 |
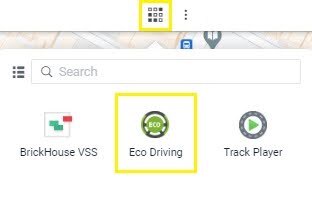
Eco Driving App
To access the Eco Driving App, click the Apps icon in the upper right corner of the screen and select Eco Driving.
Interface
There are several elements in the application interface:
- tabs (in the top bar)
- time period (in the top bar)
- statistics table (in the central bar)
- work list (to the left of the statistics table)
Moving Devices from the Work List
The work list is displayed on the left as either units or unit groups. To switch between the modes, use the /buttons. Units in the work list are sorted alphabetically by default, which can be reversed with the / buttons. Use the Search bar above the list to find a unit or unit group quickly.
All the devices on your account will be displayed in the Work List. Devices that can provide safety data will appear dark and those that cannot will be grayed out. Devices unable to run a report may simply not have any tracking data available or might not be compatible with the application.
To move a device to the Statistics Table, hover your mouse over the device and left-click on the arrow icon that appears or double-click on the device’s name. It will then appear in the Statistics Table with information for the selected period. Devices added to the table will have a checkmark next to them in the Work List.
Creating a Report
In the top bar, choose an interval for which you want to receive a driving quality assessment. You can run your report for Yesterday, Today, the current Week, or the current Month, or define your Custom time period. Using the Previous/Next arrows you can change the current report by a day, week, or month, based on your current selection.
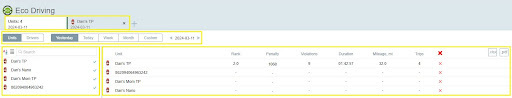
The resulting Statistics table includes the following data:
- the total number of penalty points assigned during the currently selected period
- the number of violations during the currently selected period
- the total duration of time driven during the currently selected period
- distance traveled during the currently selected period
- the number of trips logged during the currently selected period
You can filter the resulting table by any of the indicated criteria by clicking on its heading. You can delete a unit from the table by clicking on the red X in the last column of the table. Clear the entire table by selecting the red X in the table heading.
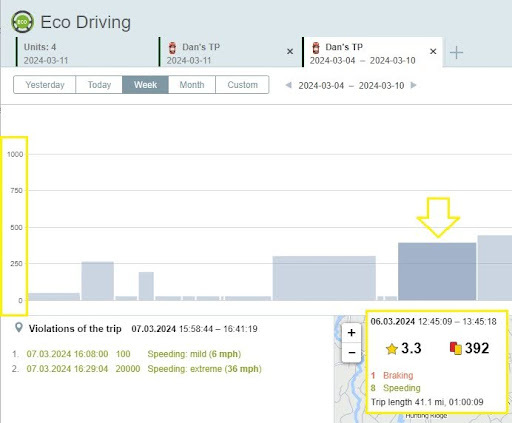
Analyzing Trips
To view details of individual trips, left-click on the unit name you want to see. The detailed report for the selected period will open in a new tab. Individual trips are displayed in the bar graph across the top, the map is displayed below to the right, and violations are displayed to the left of the map.
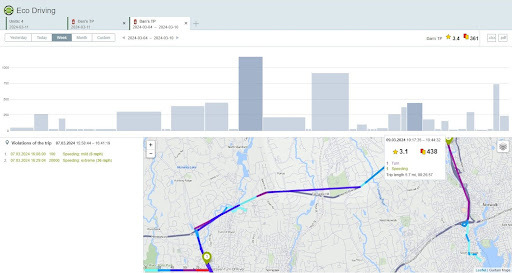
Each trip is displayed as a bar on the graph. The wider the bar, the longer the trip it represents. The height of the bar represents the number of penalty points accrued on that trip. The minimum and maximum penalty values on the indicated interval are displayed on the left. When you point to the trip bar, a tooltip with the following information appears:
- date of the trip
- start and stop time
- mileage
- duration
- number of penalty points
- rank
- number of violations on the trip
- types of violations in the trip
Clicking a bar will center the map on the locations of any violations during that trip and list individual violations on the left side. Details provided will include:
- trip date and duration
- type of violation
- value of penalty points
- value of violation
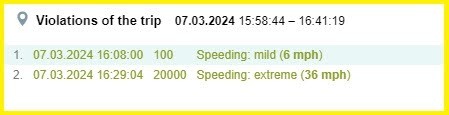
If you click on the marker of the violation on the map, the line with that violation is highlighted on the list.
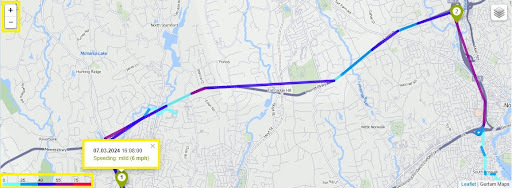
Trip tracks are colored depending on the unit speed. A scale that explains how color corresponds to speed is in the lower-left corner of the map. Violations on the track are highlighted with numbered markers. You can scale the map using the +/− buttons in the upper-left corner or using your mouse’s scroll wheel.
Exporting Data
This option allows you to export unit or unit group data to a file. There are two supported formats: XLS and PDF. To export unit group data in XLS or PDF format, click on the xsl or pdf icon, respectively, in the header of the table.
To get a file with data from one unit, point to the desired unit and click on the button that appears at the end of the line. You can also export data from the tab with detailed information about the unit. To do this, click on the export button in the upper-right corner of the workspace.
Download User Manual
Thank you for choosing BrickHouse Security for your GPS tracking solutions. We are committed to providing you with reliable service and support.
If you require further assistance or have any questions regarding our products or services, please don’t hesitate to contact us through any of the following methods:
-
Phone: 800-654-7966
-
Live Chat: Available at BrickHouseSecurity.com
Our support team is here to help ensure you get the most out of your GPS tracking experience.
Dec 22nd 2023